The Baltic Data Flows Project is now actively monitoring the access and use of datasets created under the Action, and data available from the HELCOM Map and Data Service (MADS), following the development and implementation of Key Performance Indicators (KPIs).
KPI development has been informed by findings from the MADS end-user survey conducted in March-April 2021, and the Spatineo Monitor, an online site monitoring tool that provides real-time usage analytics of the MADS. These two data collection tools are working together to monitor the project against eleven KPIs, listed below:
- Diversity of user groups
- Utilisation of data by user location
- Utilisation of data by service theme
- Frequency of use
- Purpose of data
- Importance of data
- Accessibility of data
- Number of data requests
- Number of unique visitors
- Amount of data transferred
- Number of referred data requests
Analysis of results from 158 survey respondents of the end-user survey has been used to generate the baseline for KPIs 1-7. These will be measured against findings following a repeat of the end-user survey along with the project impact assessment survey (Activity 7.4) at the end of the project.
The Spatineo Monitor usage analytics tracks monthly unique visitors, data requests, data transfers, and referrers for each service available in the HELOCM MADS. Every month data from the Spatineo Monitor is used to assess monthly, quarterly, and yearly changes in user traffic and obtain a trends analysis on user engagement with the datasets available in the MADS. The Spatineo Monitor data is used for KPIs 8-11.
An additional KPI has been developed to monitor the number of datasets downloaded from the HELCOM Metadata Catalogue (KPI 12). This data will be made available from the customized download utility developed under Activity 2.1 of BDF project during the last quarter of 2021. KPI 12 data will be available for analysis in January 2022.
The KPIs are also presented in this Power-Bi dashboard. The dashboard currently presents KPIs from Quarter 2 2021 as the baseline (page 1), and will later present an update following the repeat of the End-user survey in Quarter 2 2023. The dashboard also presents the monthly usage analysis (unique visits, and requests) for each service (pages 2, 3, and 4), data transfer rates (page 5), and the number of referred data requests by origin (page 6), all collected via the Spatineo Monitor. The interactive nature of the dashboard allows users to run quick analysis on each KPI to obtain the current status. Users of the dashboard can query data fields of interest by selecting the available visuals and filters.
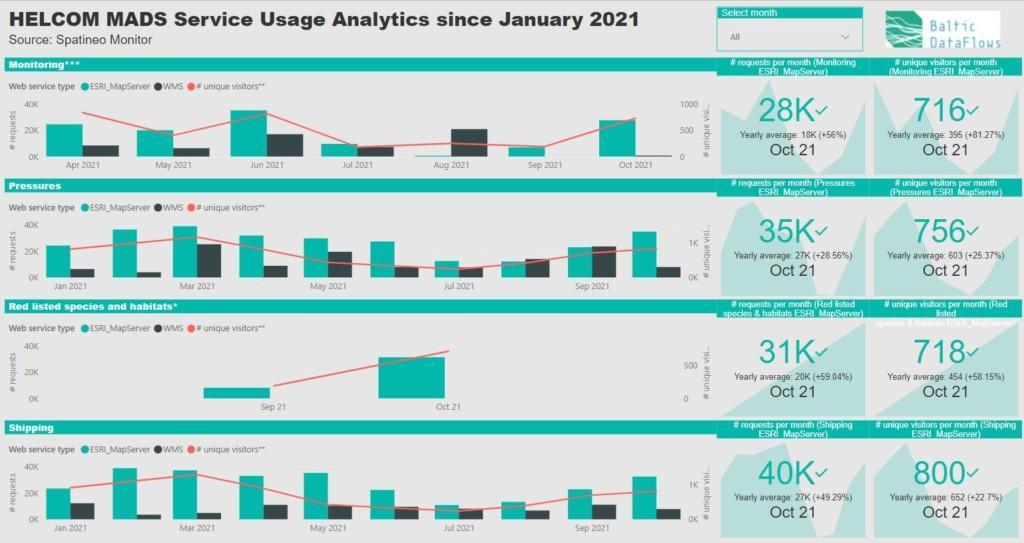
There are eight MADS services (listed below) available as both WMS and ArcGIS server types, however all MADS requests originate only from the ArcGIS server. Following the restructuring of the HELCOM MADS services in August 2021, services marked with (*) are only monitored from September 2021 onwards, and those marked with (**) from April. The restructuring aims to improve dataset navigation and accessibility as the MADS continues to host more datasets.
- Background
- Biodiversity
- Human activities*
- Indicators and assessments*
- Monitoring**
- Pressures
- Red listed species and habitats*
- Shipping
At the end of the project an impact assessment will be carried out to measure the reach of the Action. KPIs will again be used to provide further evidence along with a questionnaire that has been developed for key informants such as stakeholders and key users of HELCOM data tools and services. Findings from the survey will offer a deeper and more granular level of understanding on how user behavior has changed following the Action.