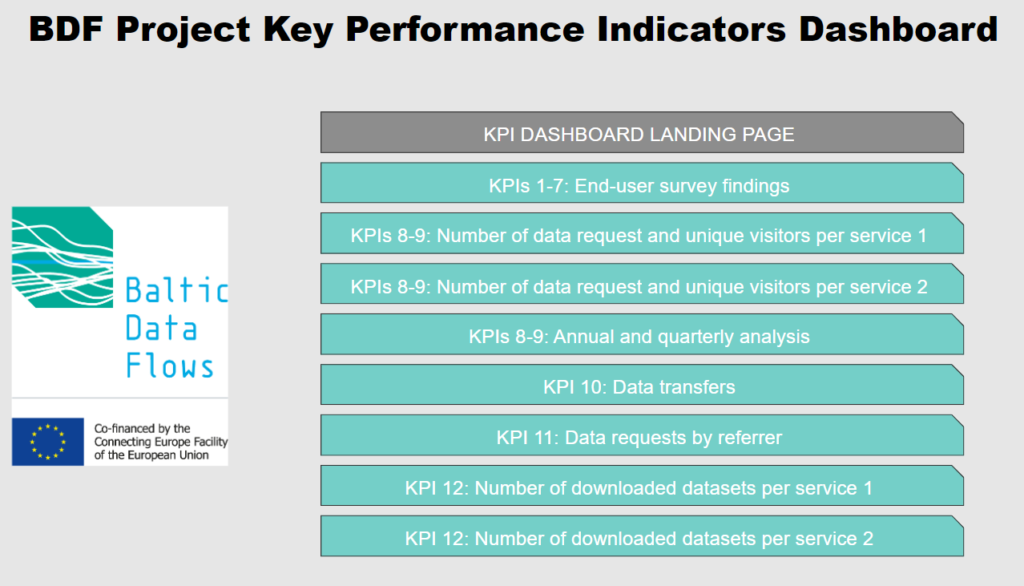
The BDF project KPIs are actively monitoring the access and use of datasets made available from the HELCOM Map and Data Service (MADS). KPIs 8-10 in particular make it possible to generate snapshot trends analysis on monthly unique visitors, data requests, and data transfers for each service available in the HELOCM MADS. Every month data from the Spatineo Monitor is used to assess monthly, quarterly, and yearly changes in user traffic and obtain a trends analysis on user engagement. Following the project half-way milestone, now is a good opportunity to take a deeper dive into data for KPIs 8-10 to obtain a comparative trends analysis. This analysis will be aided using the project KPI Power BI dashboard.
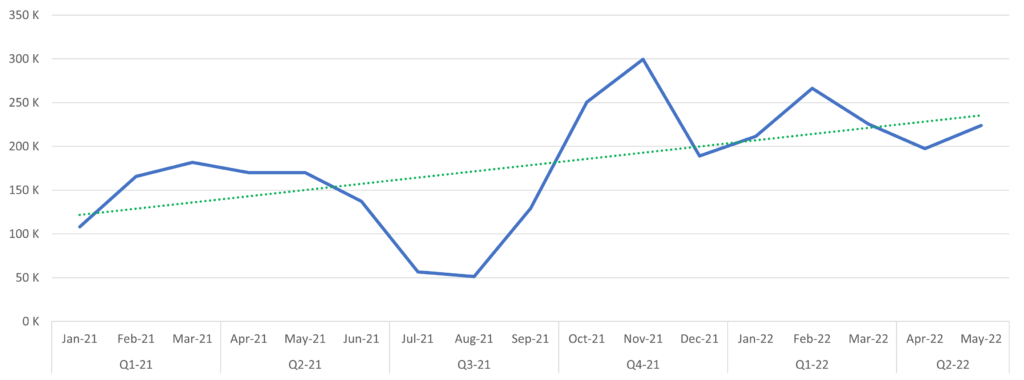
KPI 8: Number of data requests
Data for KPI 8 shows a clear increase in data requests and use for all services since January 2021, as shown in the green trendline on figure 2. The trend in data requests over the year 2021 is roughly the same for each service with a peak in data requests in March, followed by a gradual decline in requests towards June, July, and August, and then with an upward trend in quarter 4. The peak experienced in March is likely linked to an increase in user traffic with the launch of the end-user survey, and the downward trend in the summer months a result of the European summer vacations. The increased number of requests starting in quarter 4 is an indication of increased popularity of the MADS, potentially linked to the service restructuring in August 2021. Throughout quarters 1 and 2 of 2022, the MADS received an average of 225,000 data requests, an increase of 70,000 requests compared to the same period in 2021. The ‘Biodiversity’ service has received the highest amount of data requests at 548,177 requests since January 2021. This is closely followed by ‘Background’ (532,607 requests), and ‘Shipping’ (498,350 requests).
In addition, the Power BI dashboard presents KPI visuals showing the average number of data requests on each service per month. It takes the rolling yearly data request average since January 2021 for each service and highlights if the most recent month has received a higher or lower amount of data requests in comparison to that average. All services in May 2022, except for ‘Pressures’, received an above average number of data requests, indicated using the green colour and tick icon.
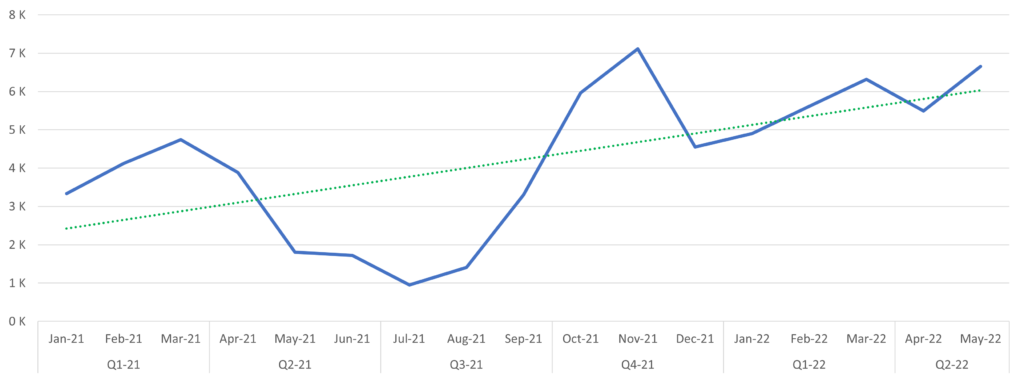
KPI 9: Number of unique visitors
KPI 9 is informed by collecting the individual IP addresses of MADS users using the Spatineo Monitor log files (the IP address data is anonymized and no personal data is collected). Similar to KPI 8, data for KPI 9 again shows a clear increase in the number of unique visitors to the MADS for all services since January 2021, as shown in the green trendline on figure 3. The shape of the blue lines in figures 2 and 3 almost match, indicating similar use trends as described above. ‘Background’ service has received the highest number of unique visitors for far (12,022 visitors) closely followed ‘Biodiversity’ (11,989), and ‘Shipping’ (11,644). Figure 3 also indicates that the MADS received the second highest number of visitors in May 2022 (6,652 visitors), recording the highest number in November 2021 (7,115 visitors).
The analysis presented here shows cumulative data since January 2021 to highlight the increase in unique visitor numbers, however unique visitor data is only captured for monthly reporting for each service. It is therefore more useful to consider the yearly average. Similar to KPI 8 on the number of data requests, KPI 9 takes the rolling yearly average since January 2021 for each service and highlights if the most recent month has received a higher or lower number of unique visitors in comparison to that average. Similar to the trend reflected in KPI 8, all services in May 2021 received an above average number of unique visitors. The ‘Background’ service has the highest yearly average at 707 unique visitors. The ‘Monitoring’ service has the lowest yearly average at 548 unique users, however monitoring of this service only stared in April 2021 in preparation for the MADS restructuring.
KPI 10: Number of data transfers
The Spatineo Monitor also monitors the amount of data transferred per service recorded as the number of mebibytes (MiB) transferred per month. Along with KPIs 8 and 9, this is another indication on the popularity of MADS services, but instead shows how much data is transferred or downloaded using the MADS. As shown in figure 4, the trend in data transfers is slightly different compared to the number of data requests and unique users and is more stable across the year. There was no peak coinciding with the launch of the MADS end-user survey indicating that users were simply viewing the service but not actually downloading data at the time. There is a decrease in the number of data transfers in the summer months and a strong upward trend starting from September. Similar to data presented in KPI 9, the ‘Background’ service is the most popular with a total transfer rate of 6,565 MiB. This is followed by ‘Shipping’ (4,379 MiB) and ‘Pressures’ (3,913 MiB).
This brief dataset access and trends analysis using KPIs 8-10 indicates that the HELCOM MADS is increasing in relevance and popularity over time. Following the project half-way milestone there is still some work to do to ensure this trend and momentum is maintained. Task 2.2 of Activity 2 (further development of the HELCOM MADS) allocates resources to improve the service with work scheduled to start in quarter 3 2022. These improvements will be partly informed by findings from the end-user survey conducted in April 2021.
KPI analysis will continue throughout the project. The Power BI dashboard is updated every month with new data from the Spatineo Monitor. The project impact assessment under Activity 7.4 at the end of the project will further consider data from KPIs 8-10 in order to evaluate if data requests, visitor numbers, and data transfer rates have increased or decreased over the project period.