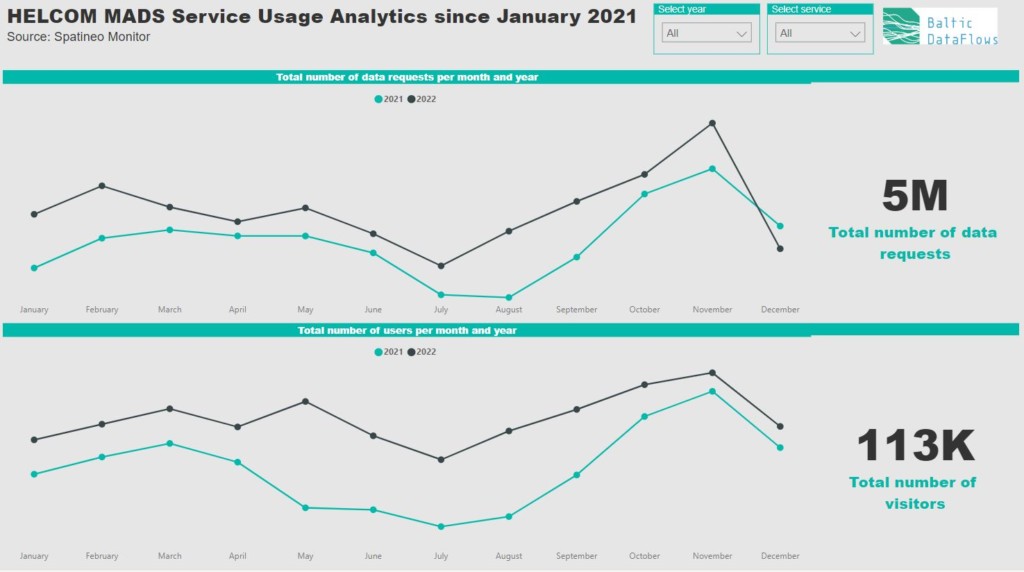
Since January 2021 the BDF project KPIs have monitored the access and use of datasets made available from the HELCOM Map and Data Service (MADS). Now with two full years of data we can see that in 2022 the MADS received 2.64 million data requests, an increase of 740,000 (16%) compared to the previous year of 2021 at 1.9 million data requests.
For all months of 2022 (except December) the MADS received a higher volume of data requests and unique visitors compared to each month in 2021, as illustrated in the screenshot below from the BDF KPI Power BI dashboard. In total the MADS has received 5 million data requests from 113,000 users since January 2021. For both years the month of November received the highest volume of user traffic with a peak of 387,135 data requests and 7,960 visitors in 2022. The months of June, July, and August received the lowest volume of user traffic in both 2021 and 2022 coinciding with the European summer holidays.
There was a monthly average of 622 users in 2021, with an increase of 113 monthly users, up to 735 in 2022. Most services received higher volumes of traffic in 2022, except the Biodiversity service that received the record highest volume of data requests (410,604) in 2021. The Biodiversity service also received the record highest volume of visitors in 2022 at 9,481 in total. Increased user traffic in 2022 also corresponds to increased data transfers from the MADS with 24,239 MiB transferred in 2022, 26% more (10,477 MiB) more than the previous year of 2021 at 13,762 MiB.
Monitoring of the MADS, and the subsequent development of project KPIs, is made possible by the Spatineo Monitor provided by project partner Spatineo. The Spatineo Monitor usage analytics tracks monthly unique visitors, data requests, and data transfers for each service available in the MADS. Every month data from the Spatineo Monitor is used to assess monthly changes in user traffic and obtain a trends analysis on user engagement informing KPIs 8-10. Analysis on KPIs 8-10 was featured earlier last year, with further analysis planned later in the year with the BDF project impact assessment.